← Selected Works
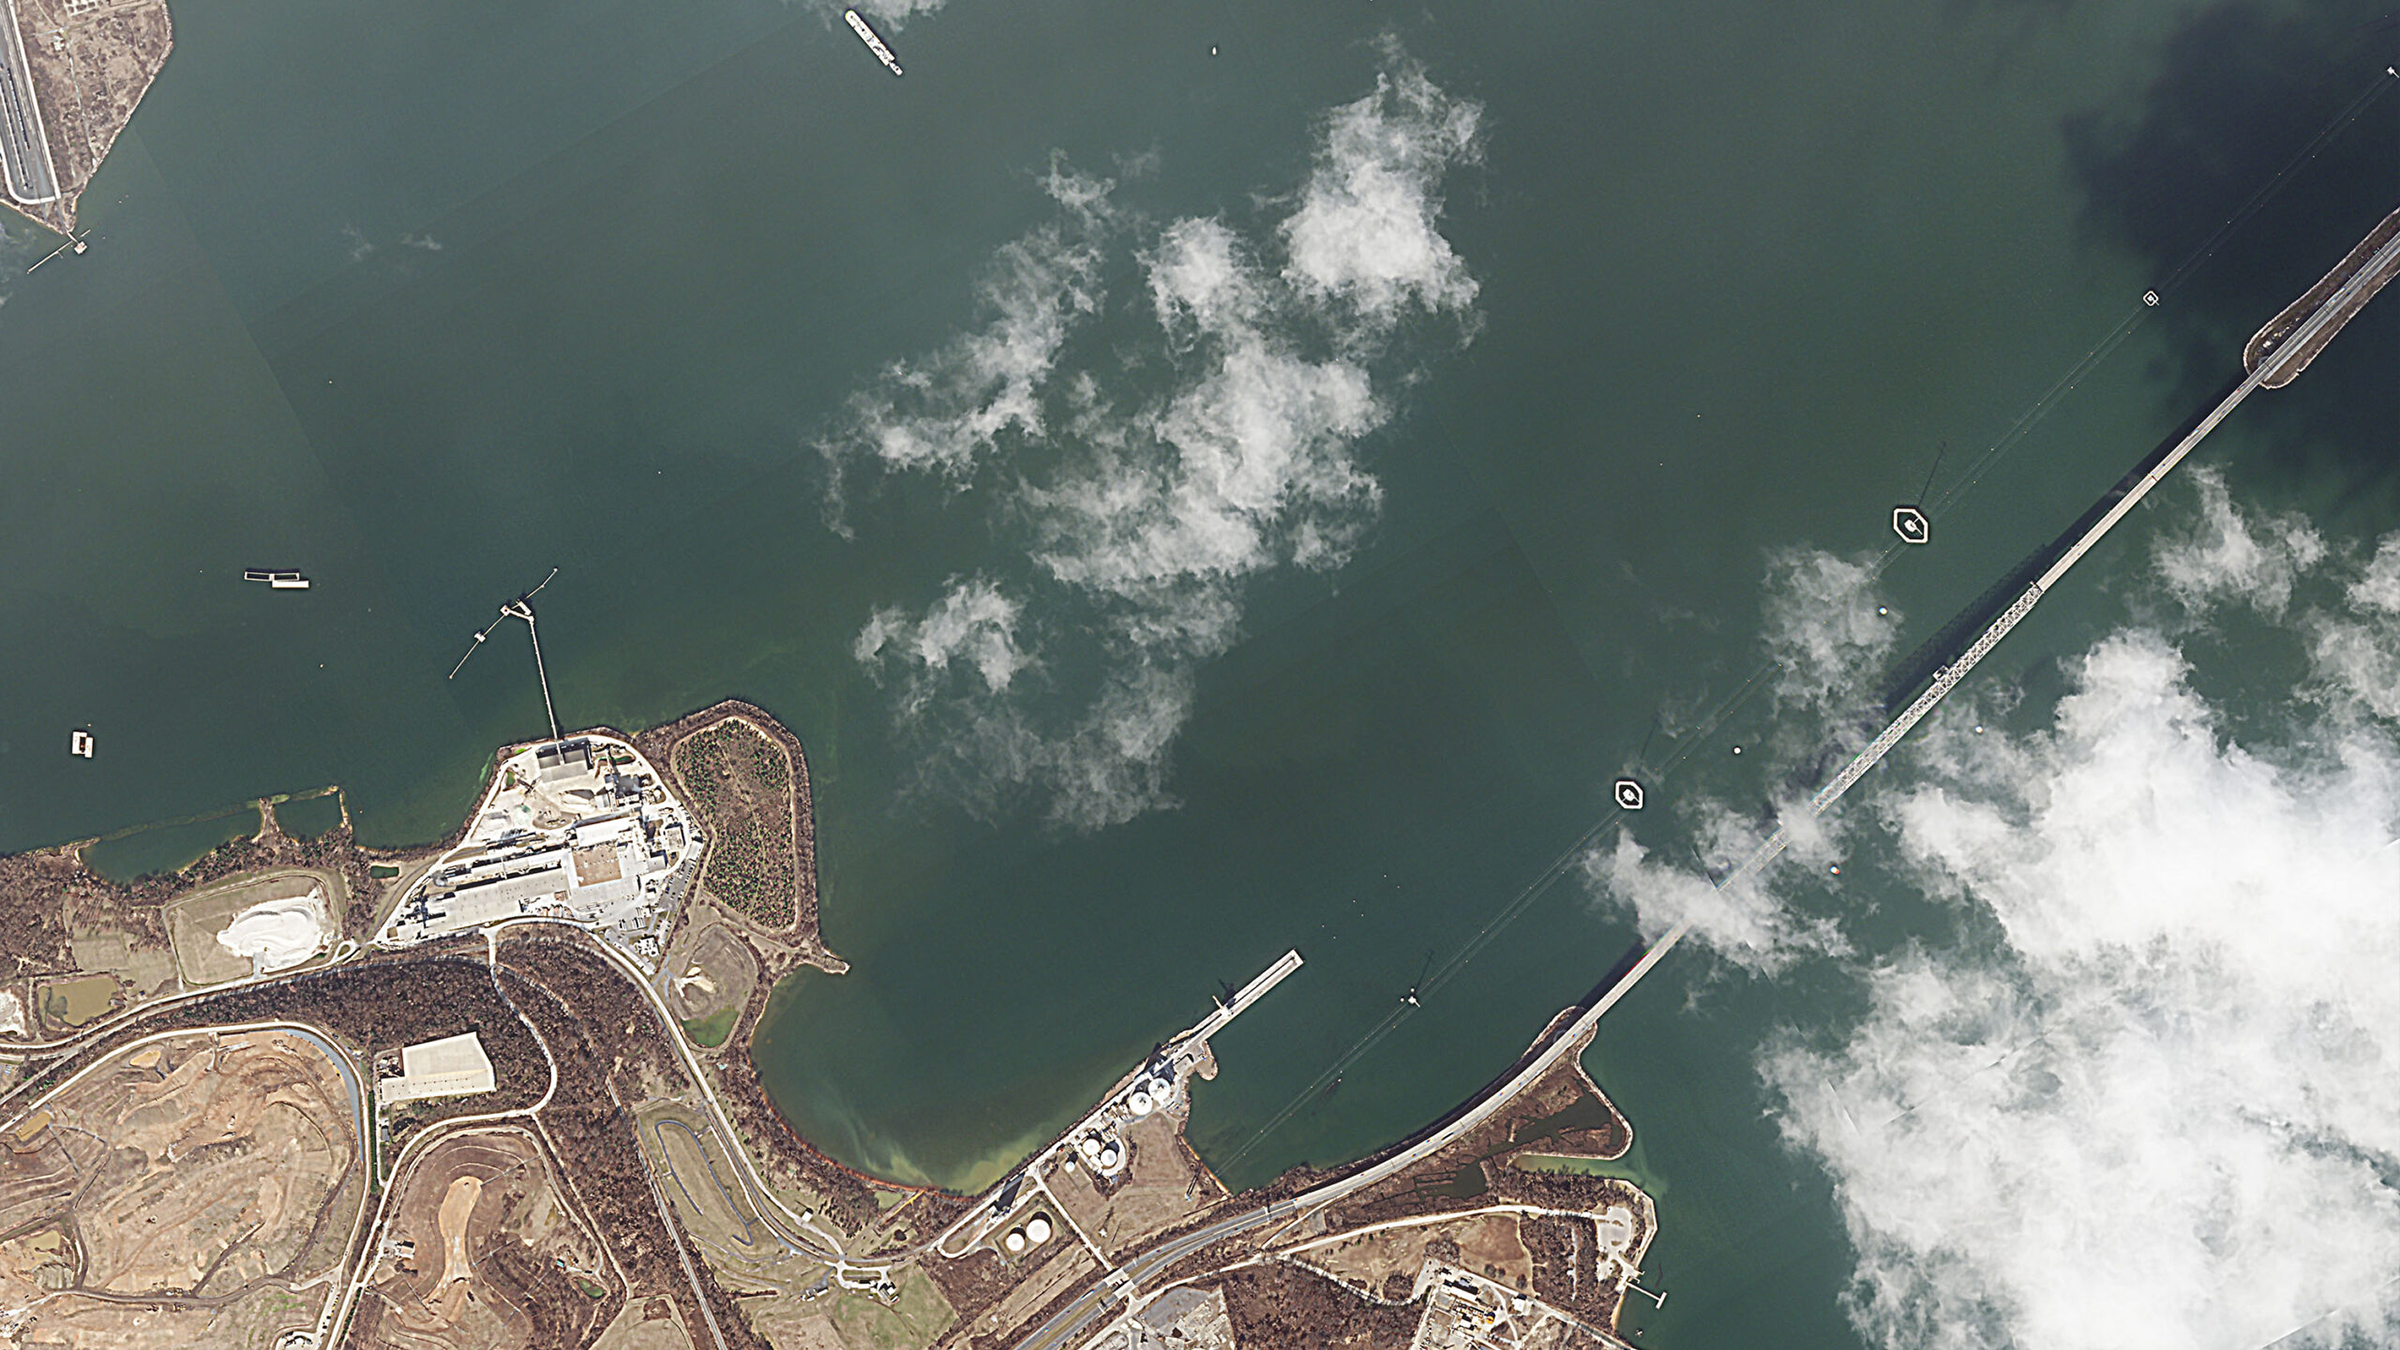
Satellite view of the collapsed Baltimore bridge and salvage operation
Earth Observation · (Re)Insurance

Satellite Club

A members platform that puts Earth Observation and satellite intelligence directly in the hands of underwriters, brokers and claims teams, in time to matter.

Client

Skytek

Role

Product Design & UX/UI

Platform

Members web platform

As Senior UX/UI Designer at Skytek, I shaped the Satellite Club product experience: how one platform serves two very different audiences, how the reports and imagery are structured and presented, and the interface and visual direction.

My scope
Product experience, information architecture, interaction design (including the before-and-after comparison and the login overlay), and interface design and visual direction.
Product
A members platform that turns Earth Observation into reports insurers can use. Imagery comes from six satellite data providers (Planet, ESA, NASA, Airbus, Copernicus and ICEYE) and the service covers eleven application sectors, so members get one point of access instead of a separate relationship with each provider.
Users
(Re)insurance professionals: underwriters, brokers, claims and loss teams, risk managers and modellers, and legal counsel.
The Problem

Space data the insurance market could not actually use.

The problem was access. An underwriter pricing a Gulf tanker risk, or a claims manager assessing a hurricane loss, does not want a data feed, a tasking request form or a GIS tool. They want a defensible answer about a specific location, quickly, in language that survives being put in front of a client or a court.

Framing

A membership, not a data subscription.

Members get commissioned proprietary reports from the Skytek expert panel, image acquisition tools, advice on cost-effective tasking, priority access to major-event reports, workshops, and expert witness support. That is a service, not a stream of imagery.

The framing also settled a positioning question. Sold as software, it competes with GIS platforms on features it does not want to compete on. Sold as a club with an expert panel behind it, the product is judgement, and the technology is how the judgement gets made.

The Hard Constraint

Two audiences, one page, opposite needs.

A first-time visitor needs to understand what Earth Observation does for their book of business. An existing member arrives looking for the report published this morning on the Strait of Hormuz.

Rather than splitting into a marketing site and a separate logged-in app, the page runs the proposition top-down and puts the live reports high on the same page. Login is a lightweight overlay rather than a destination, so a returning member never has to go through the pitch to reach the reports.

Audience & Value

Who it is for, and what they actually get

Both are (re)insurance professionals: underwriters, brokers, claims managers, loss adjusters, corporate risk managers, legal counsel and risk modellers. What differs is where they are in their relationship with the service.

Prospective members

Discovering the service

  • Understand the offer from a single claim: Earth observation at underwriting speed
  • See the latest reports as proof the service is live
  • Check whether it is for them against the list of roles it serves
  • Explore sample before-and-after imagery and the sectors covered
  • See what membership includes, then become a member

Existing members

Using the intelligence

  • Log in through a lightweight overlay, without going through the pitch
  • Go straight to the reports library, filtered by risk type
  • Read full reports: key figures, analysis, dated imagery and sources
  • Download reports as PDF for the file
  • Priority access to major-event reports, and commissioned reports from the expert panel
  • Image acquisition tools, tasking advice, workshops and expert witness support
Design Principles

Three rules for evidence design

This content ends up in pricing decisions, claims files and legal submissions. That raises the bar on how it is presented.

01

Imagery is evidence, not decoration

Every satellite image carries its location, capture dates and provider. Nothing is cropped or colour-graded in a way that would not survive scrutiny.

02

Recency is a first-class signal

In a fast-moving war-risk or catastrophe scenario, a report from ten days ago is a different product to one from this morning. Dates are given the same weight as titles.

03

Insurance language, not space language

Aggregation, exposure, hull and cargo, renewal. The interface speaks the reader’s vocabulary, and keeps the orbital mechanics behind the curtain.

Before & After

The same coordinates, before and after

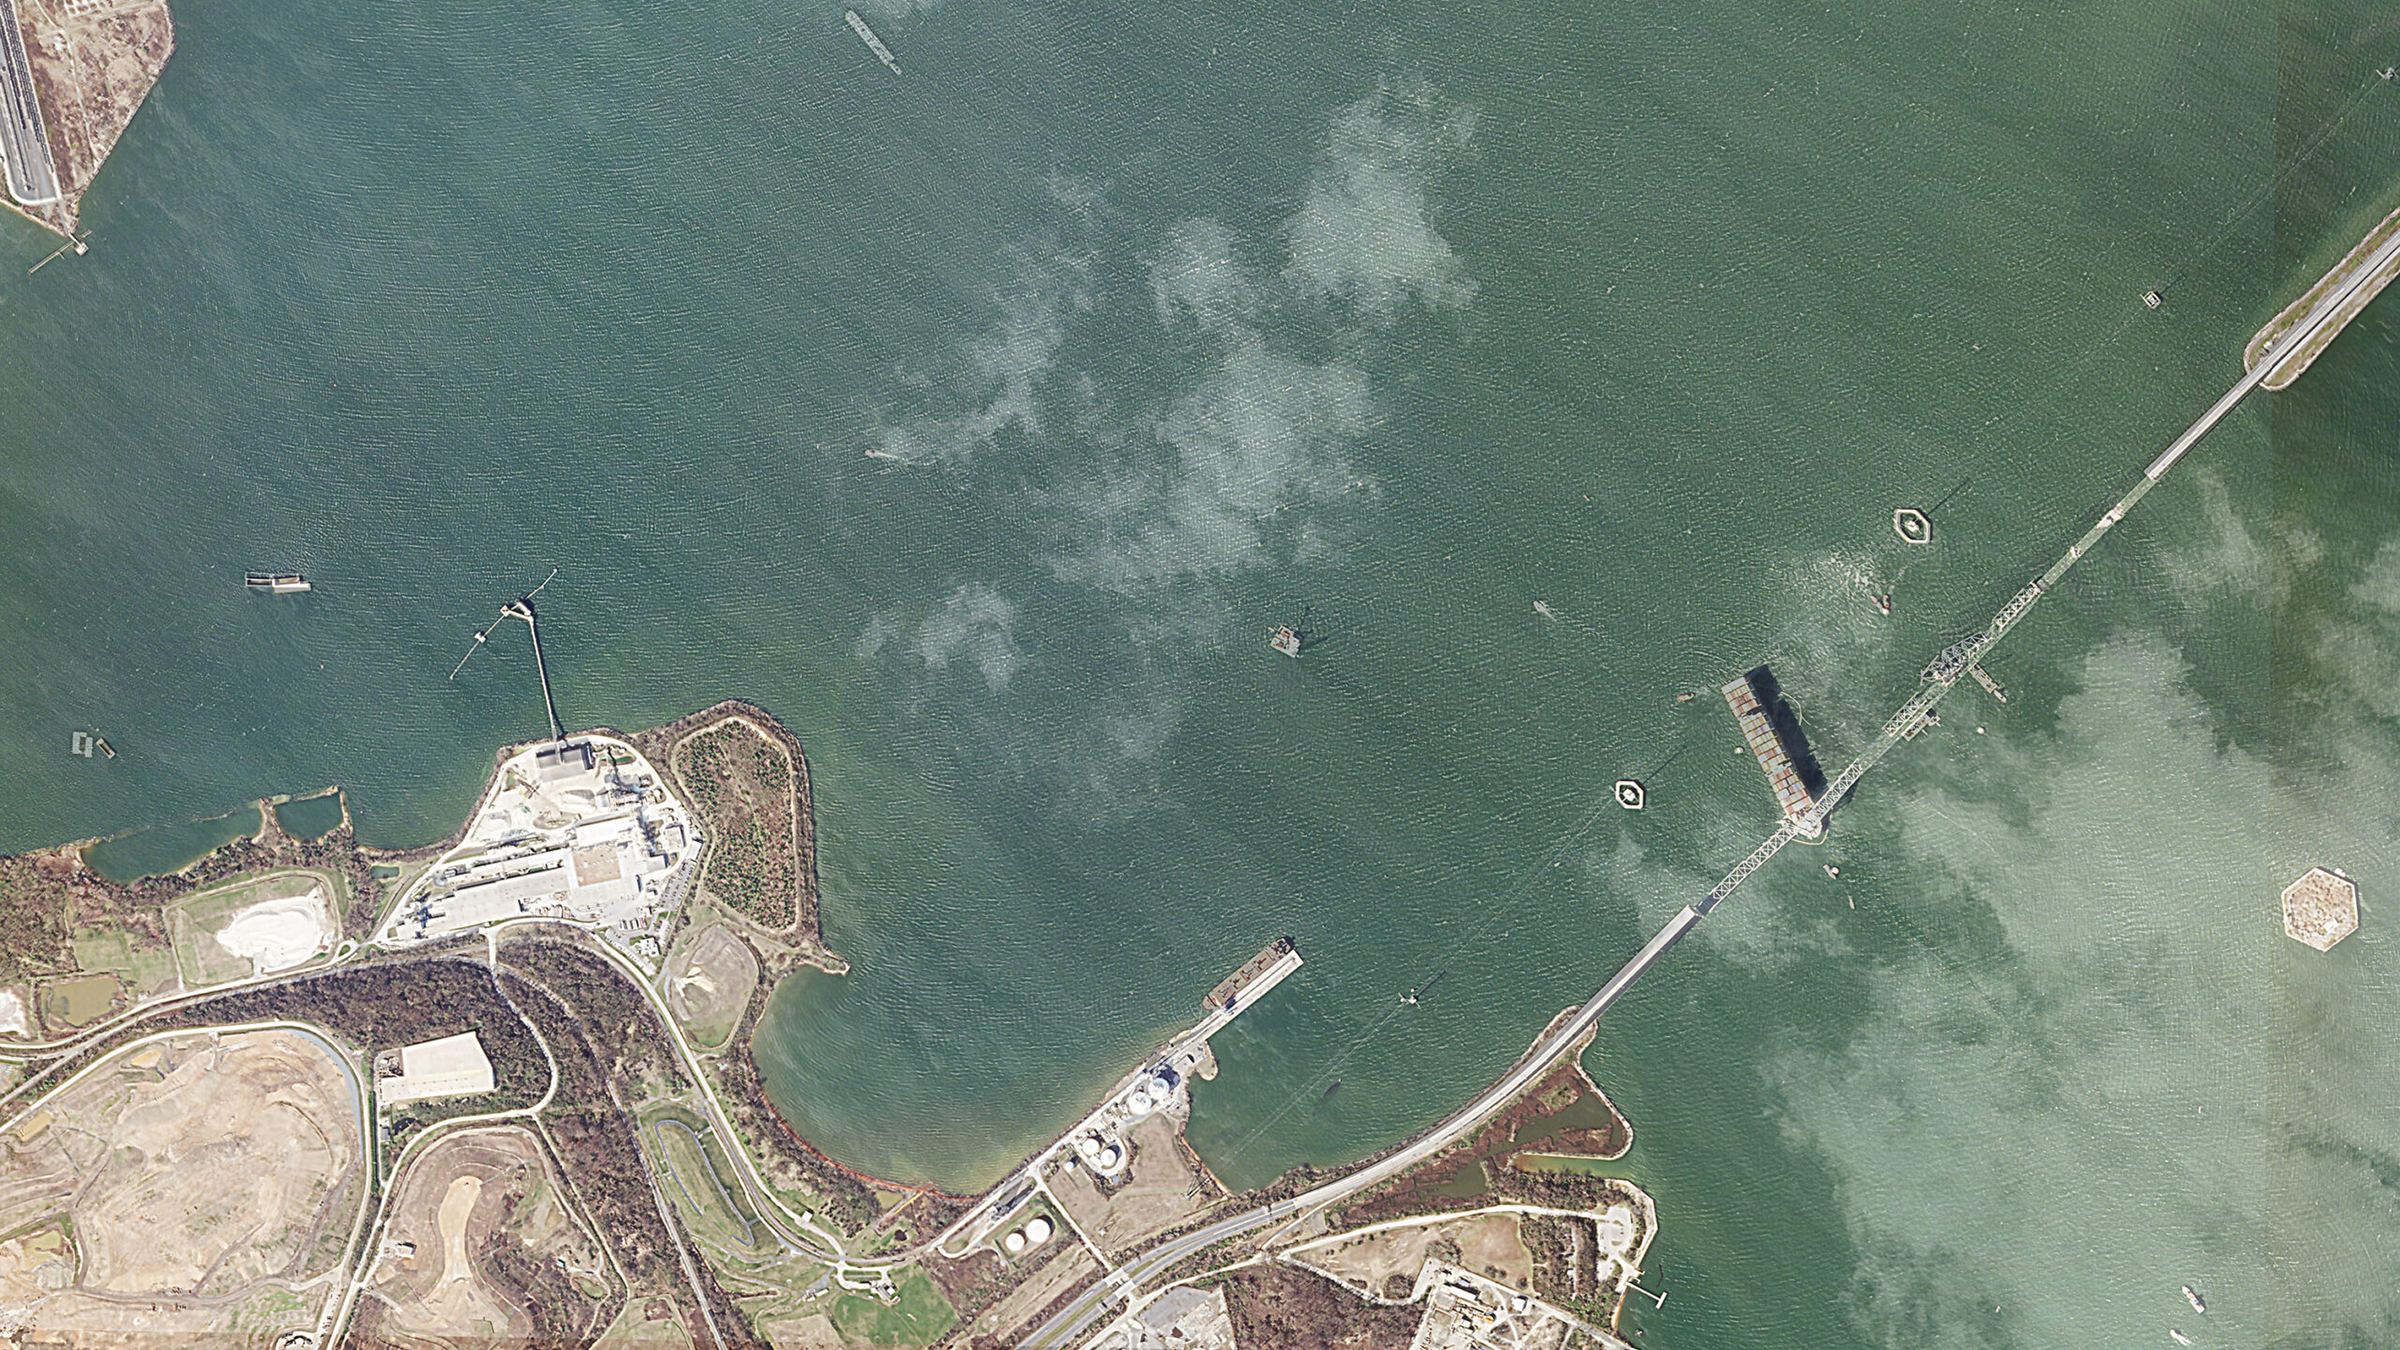
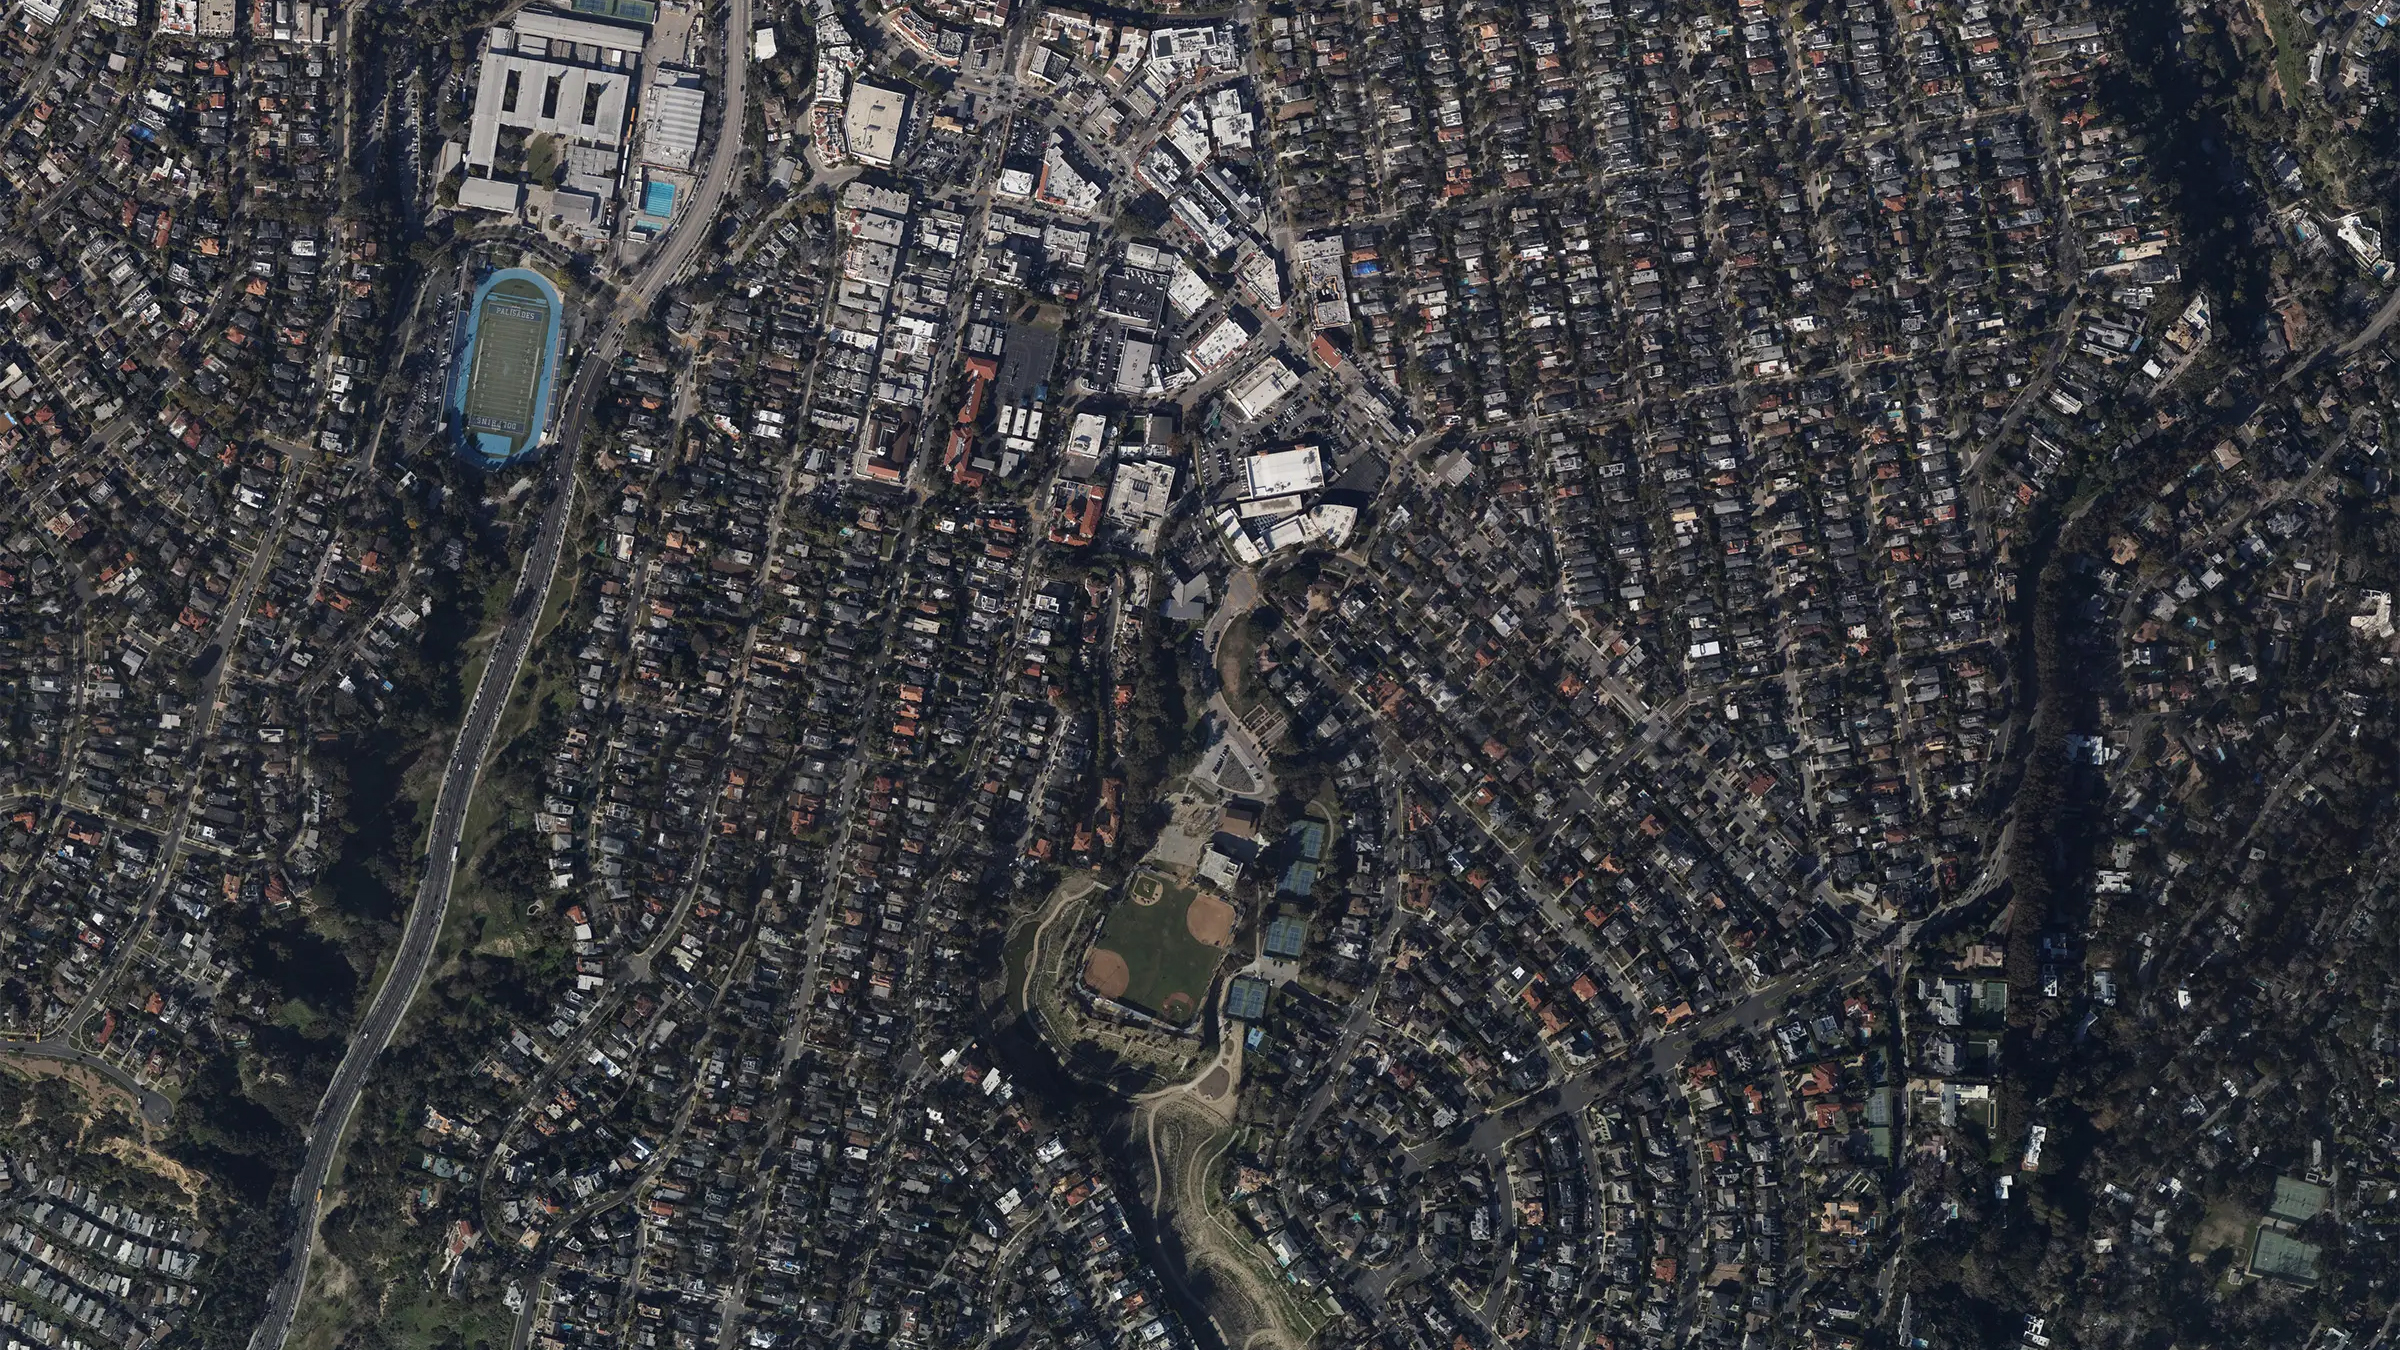
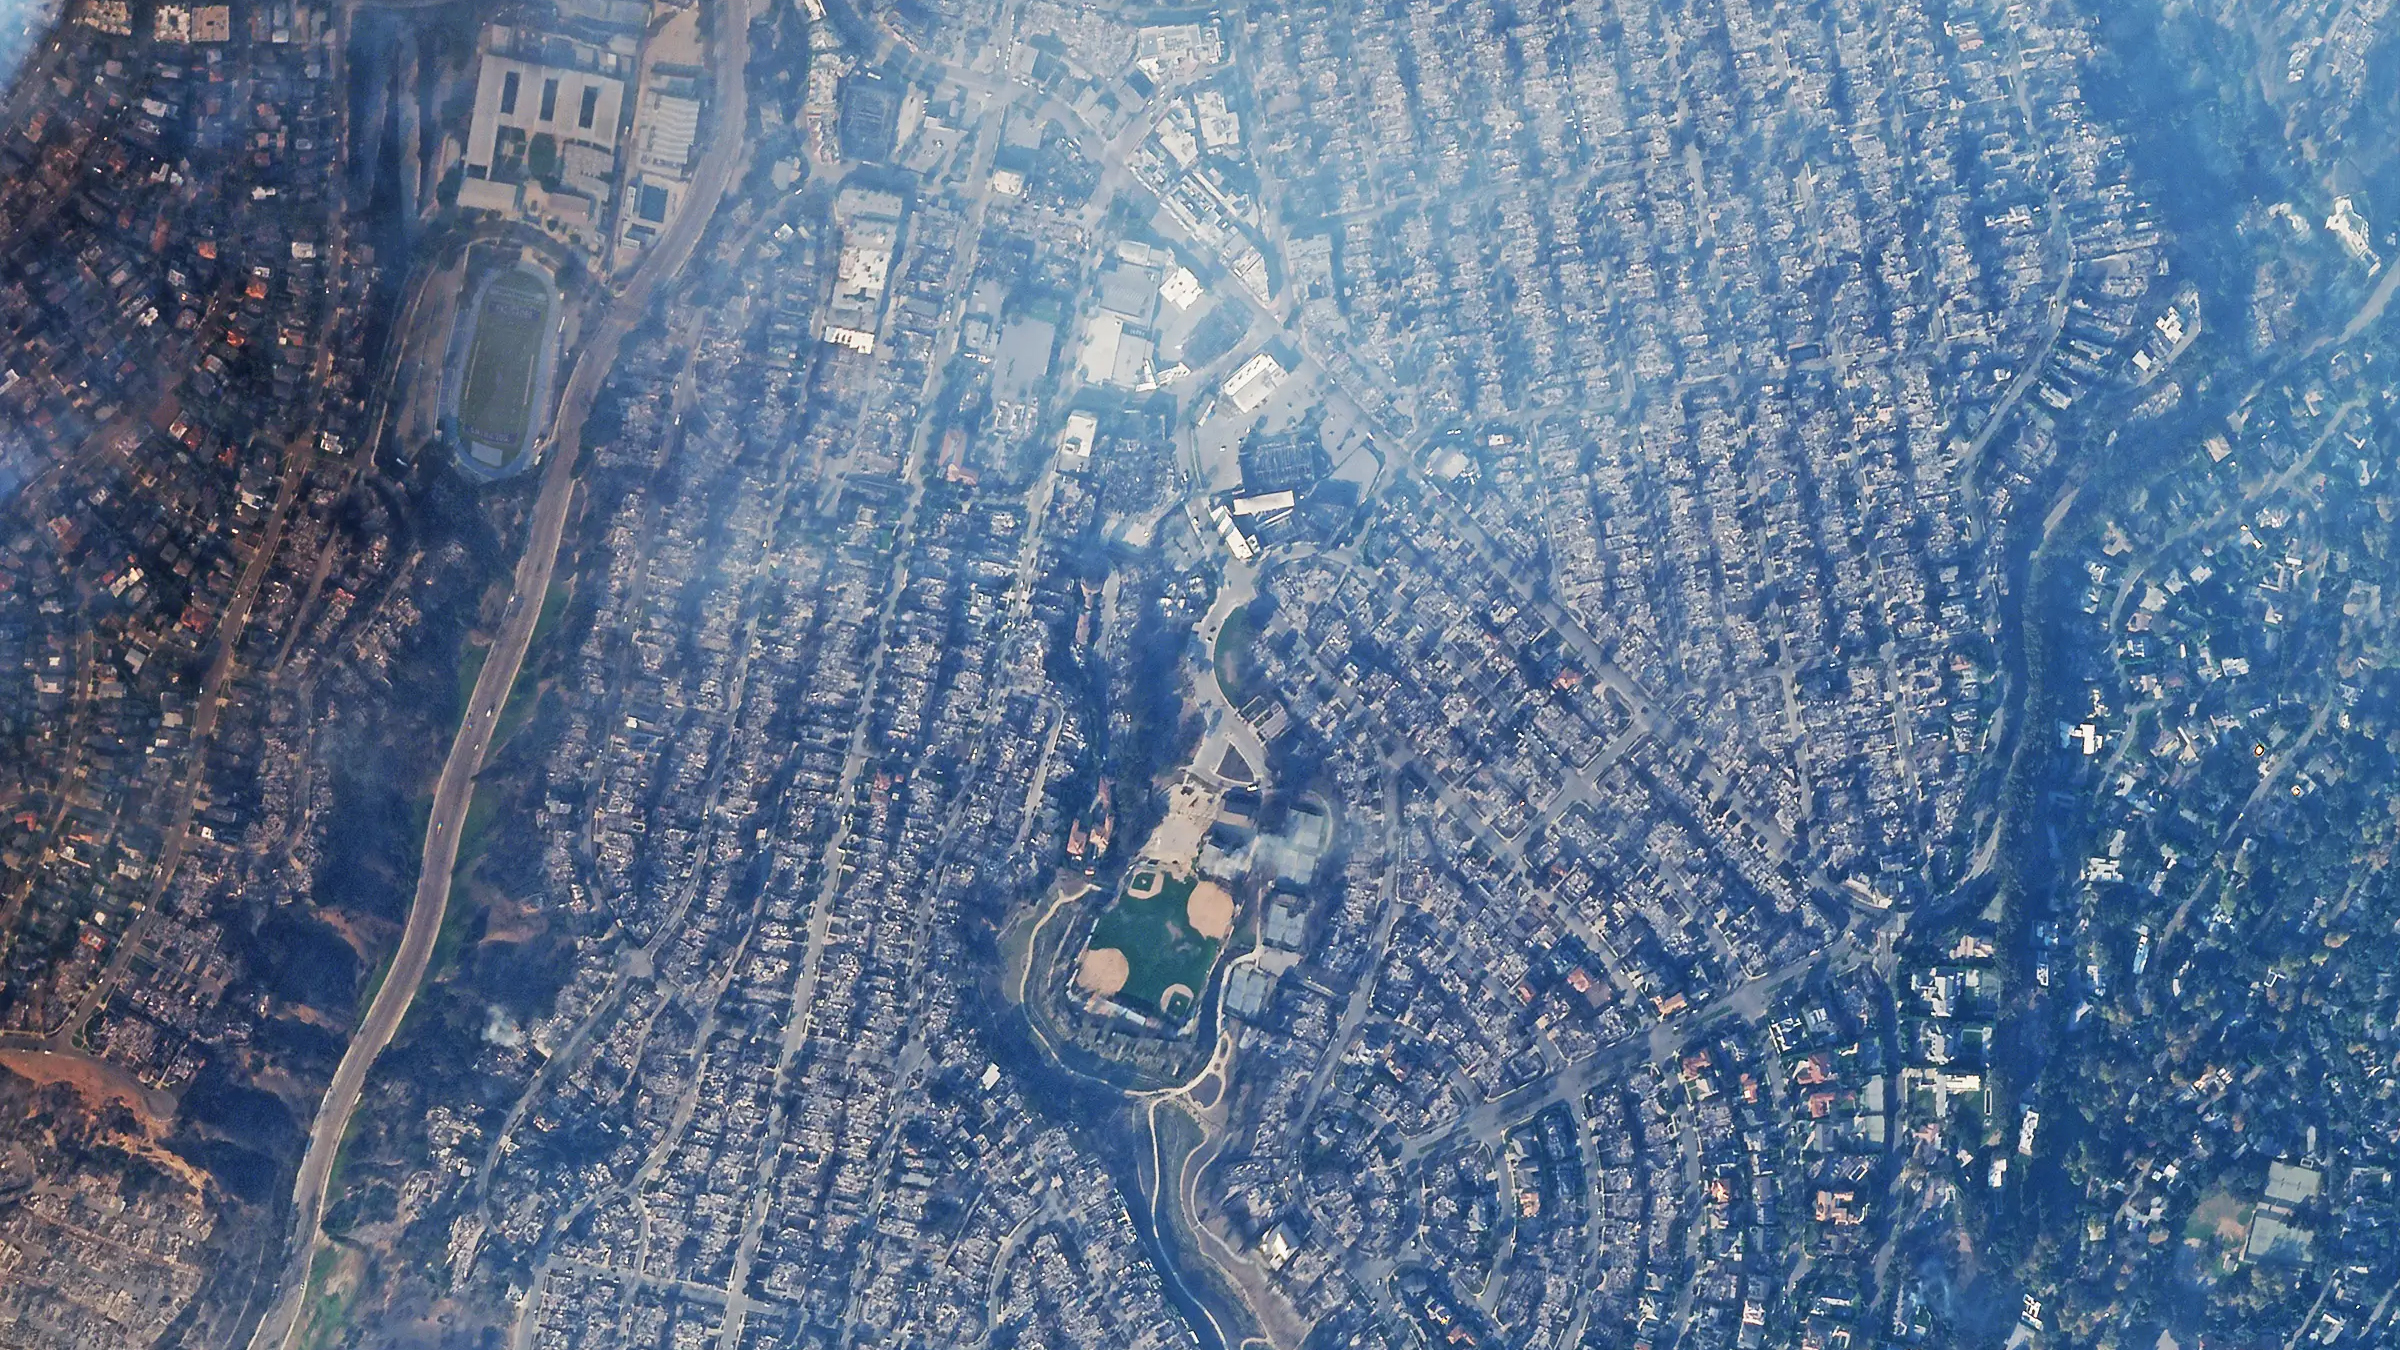
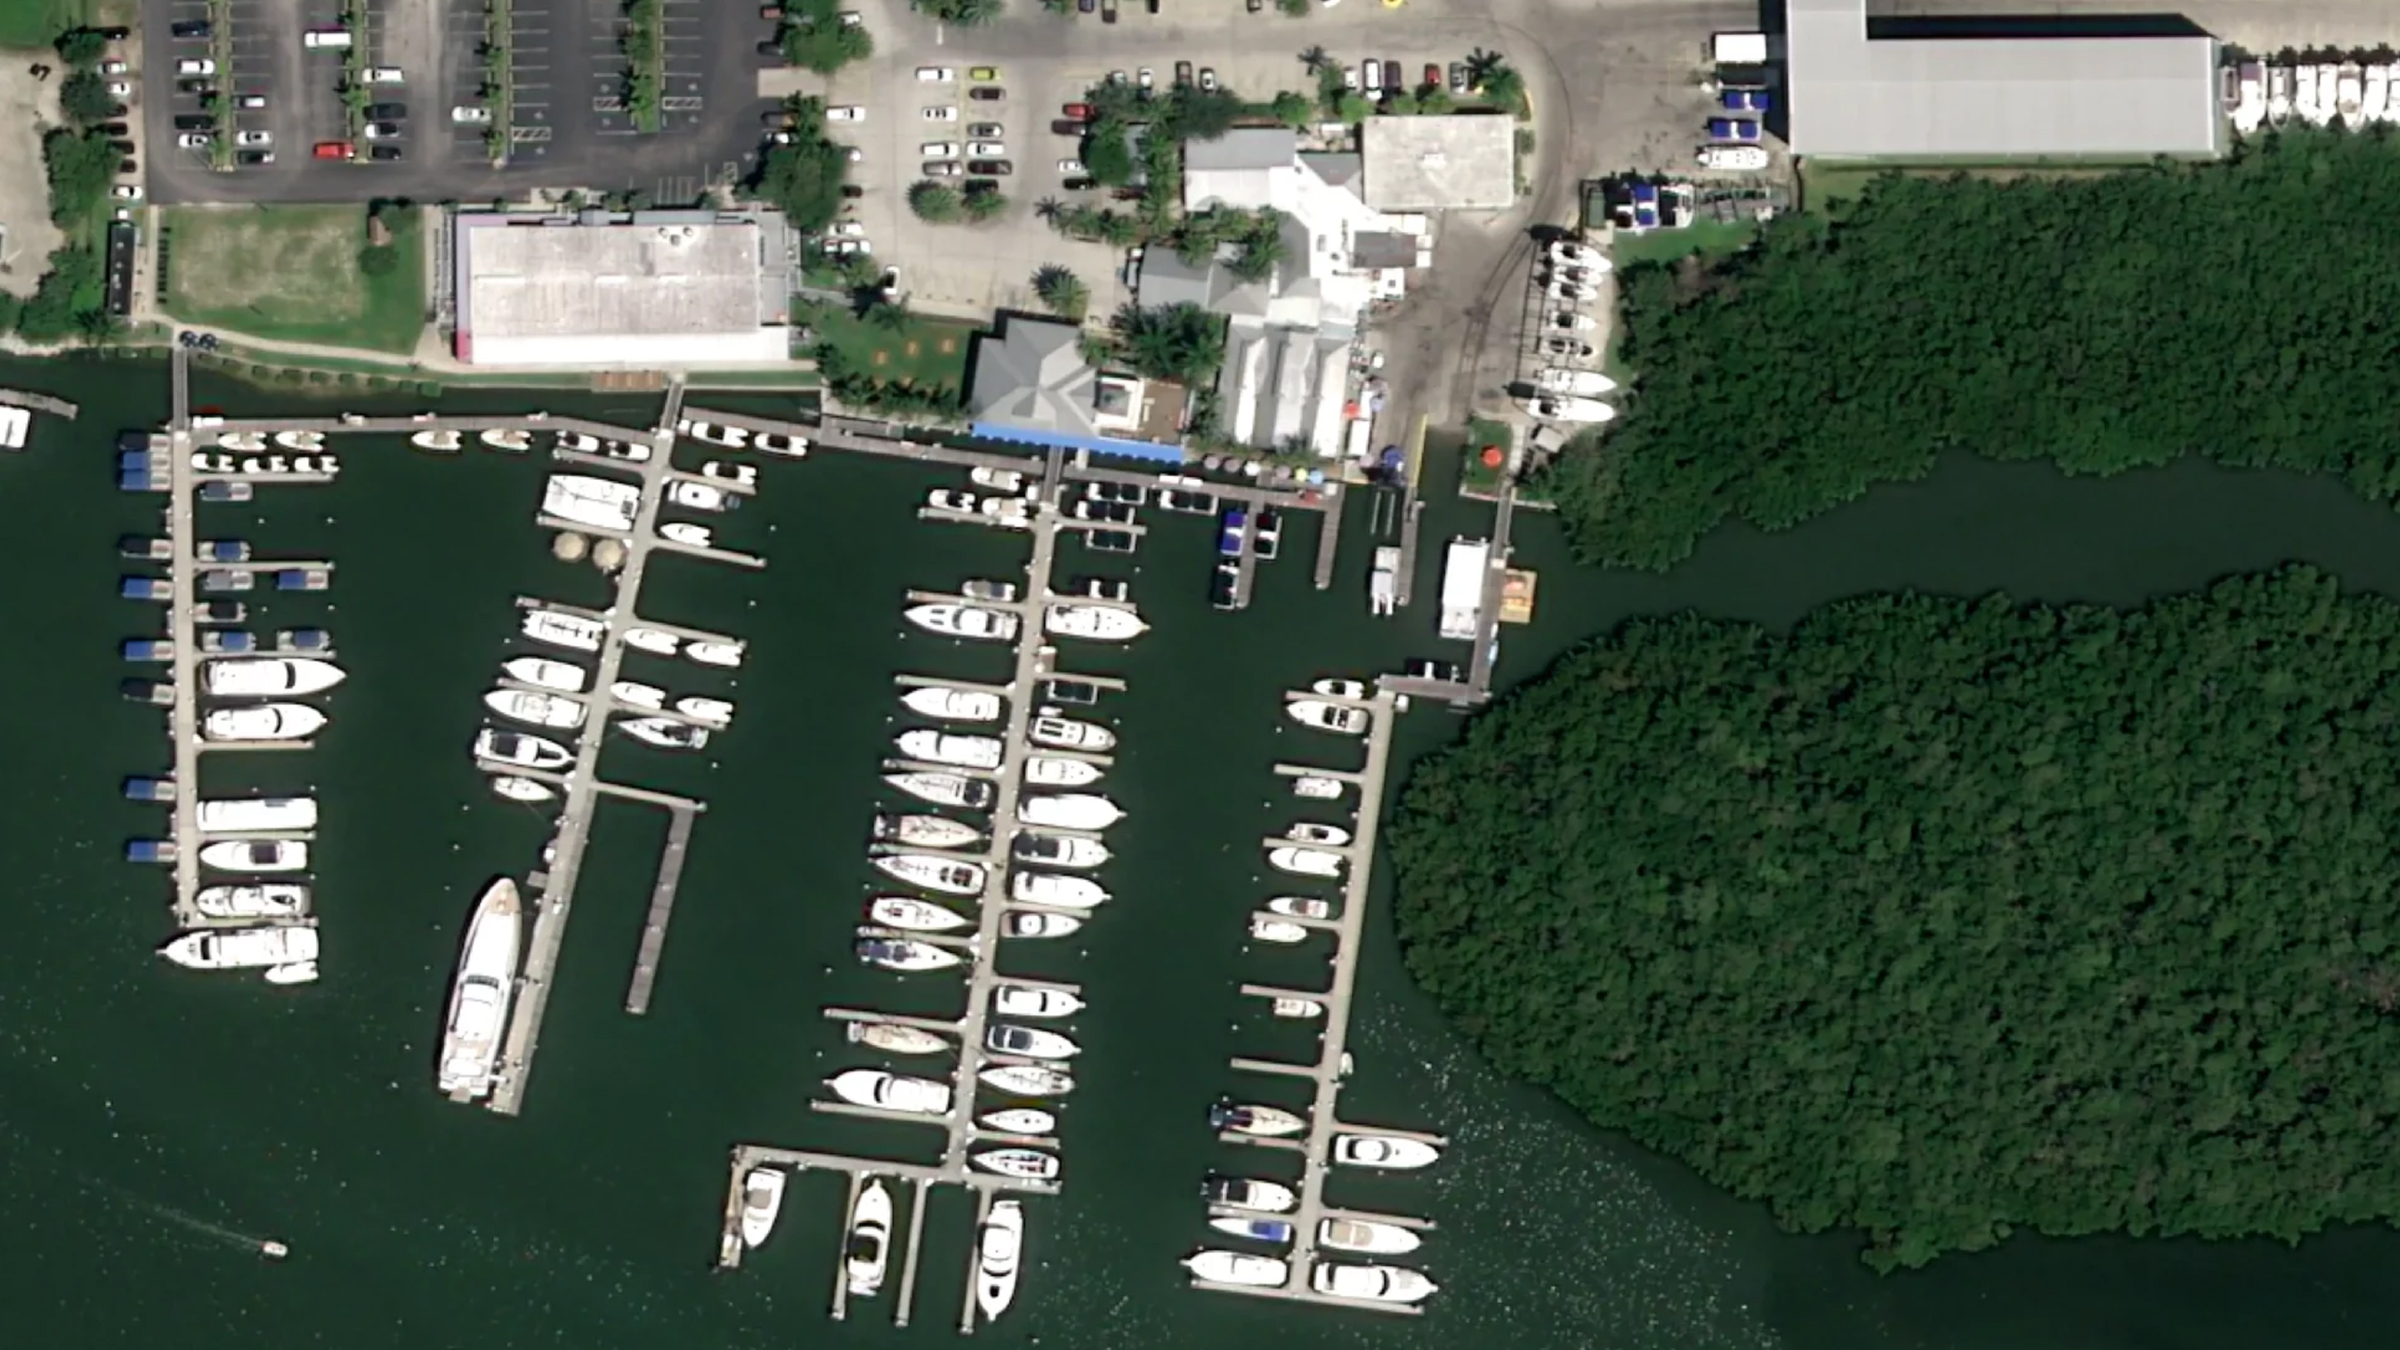
Paired acquisitions of the same coordinates are the most persuasive thing in the product. A fixed template keeps the location, both capture dates and the framing constant, so the change is the only thing that varies. Drag the handle to compare, or choose another event.

Maritime Incident

Francis Scott Key Bridge, Baltimore · 24 Feb 2024 to 29 Mar 2024

Satellite view of the Francis Scott Key Bridge, Baltimore, before the collapse Satellite view of the Francis Scott Key Bridge, Baltimore, after the collapse Before After
Drag to compare

California Wildfire

Pacific Palisades, California · 2023 to 2025

Satellite view of Pacific Palisades, California, before the wildfires Satellite view of Pacific Palisades, California, after the wildfires Before After
Drag to compare

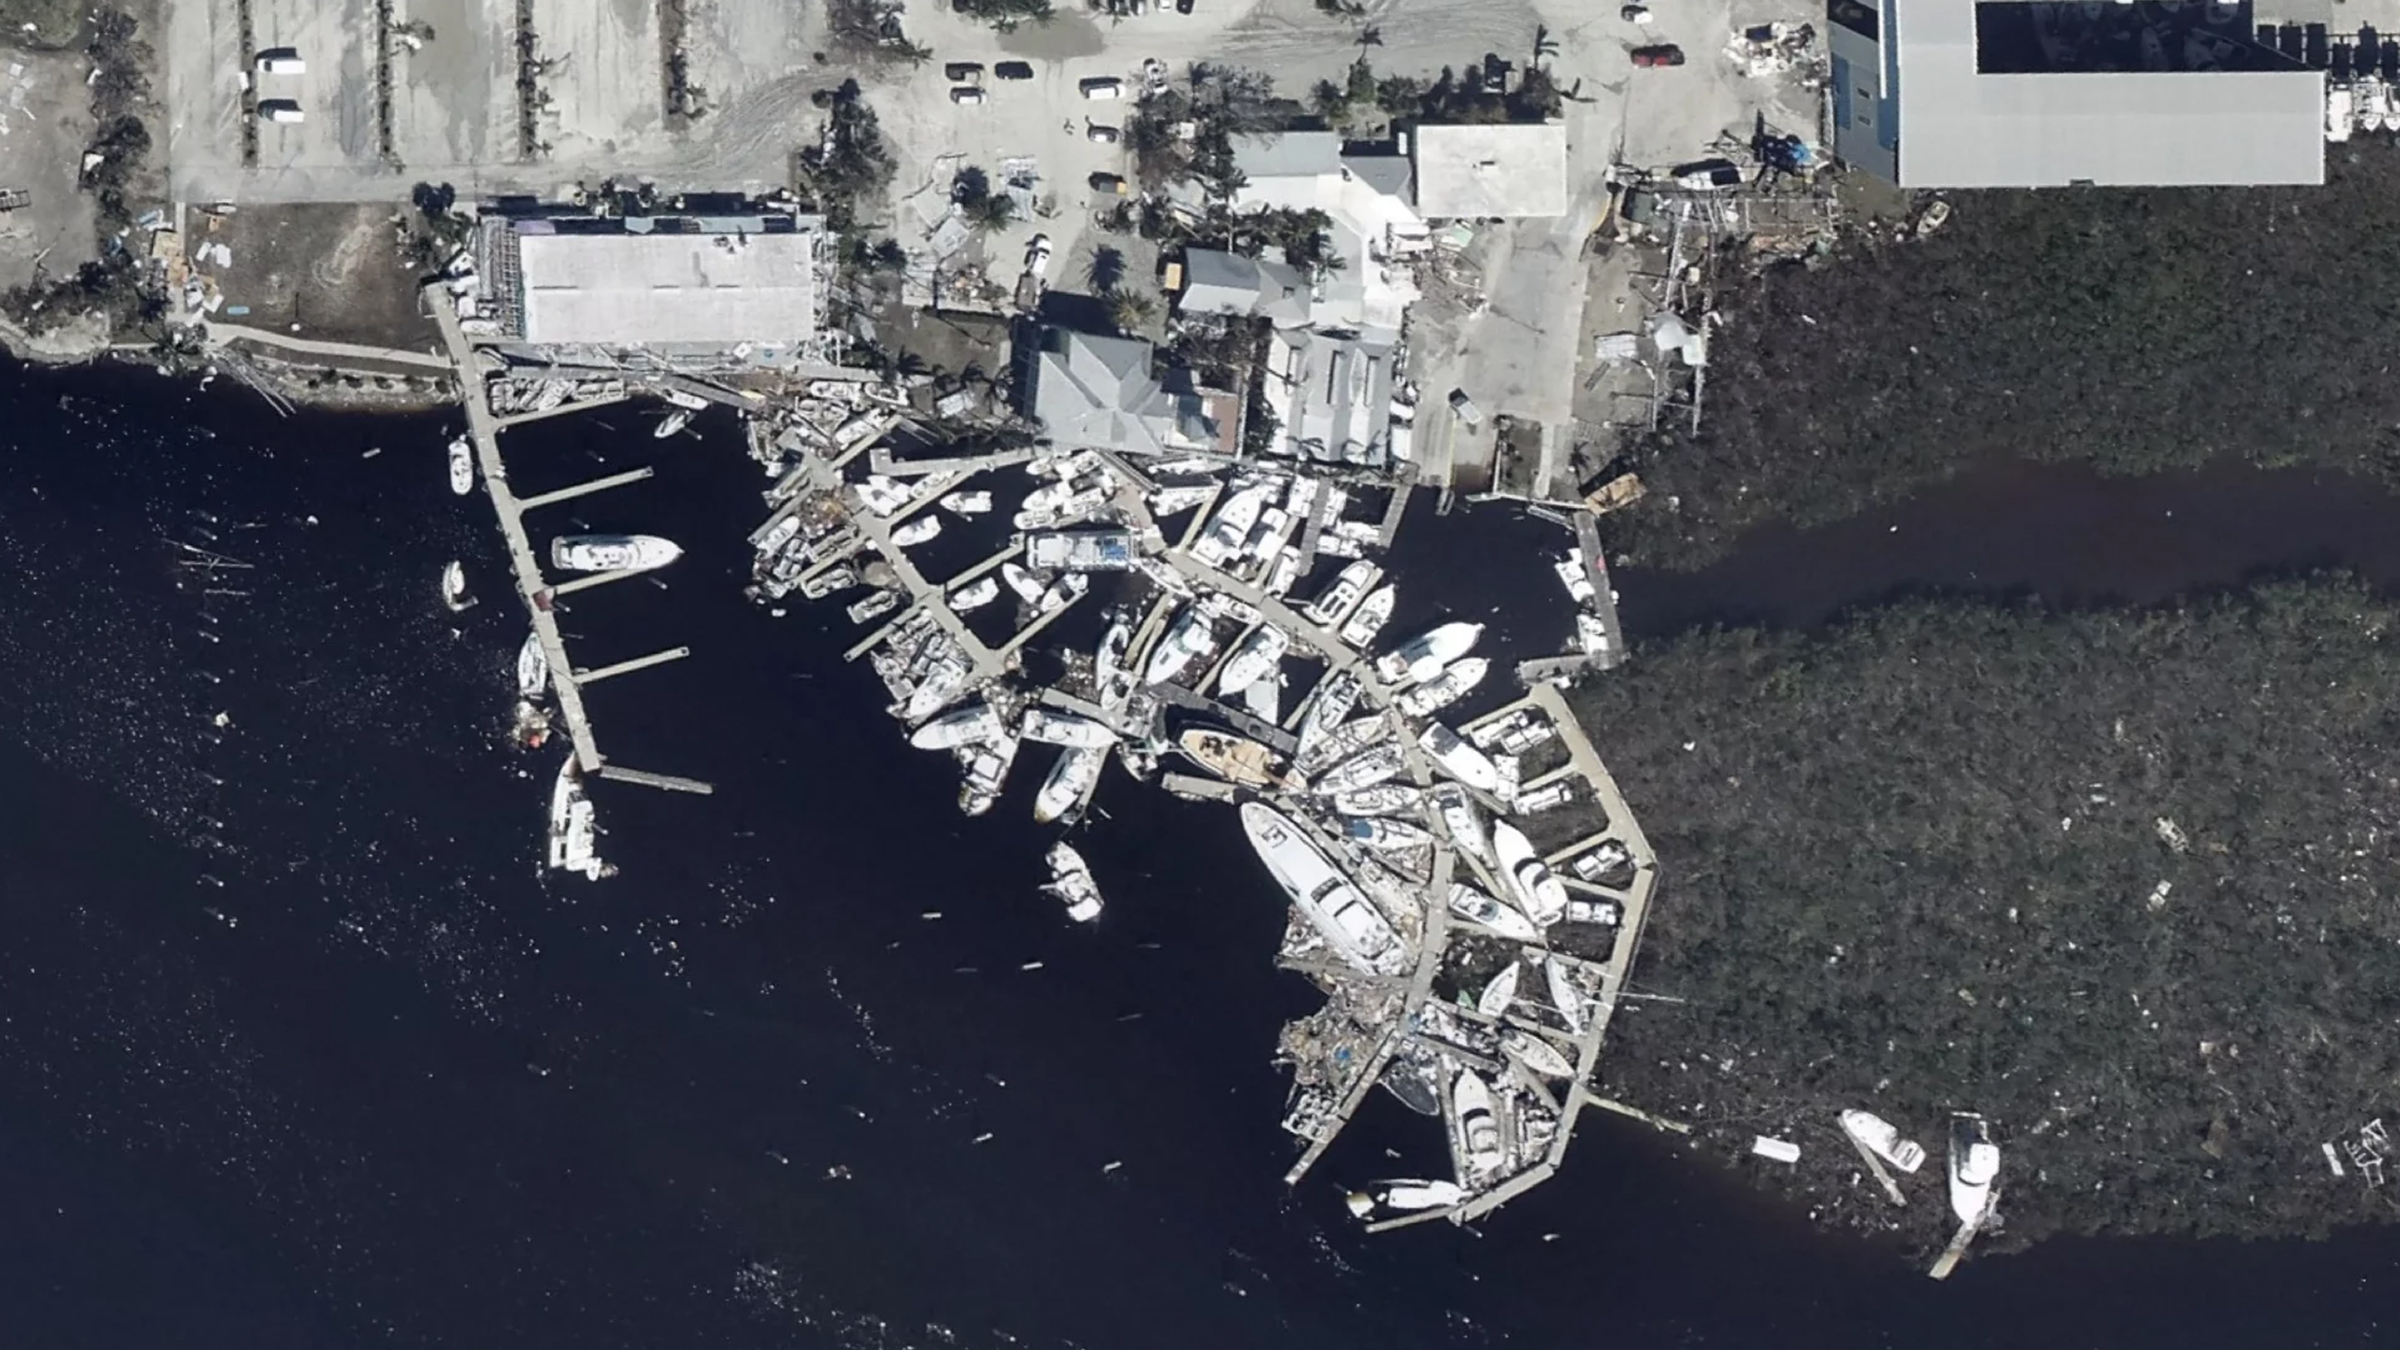
Hurricane Ian

Salty Sam Marina, Fort Myers

Satellite view of Salty Sam Marina, Fort Myers, before Hurricane Ian Satellite view of Salty Sam Marina, Fort Myers, after Hurricane Ian, with boats and docks piled together Before After
Drag to compare
The Platform

From proposition to live intelligence in one scroll

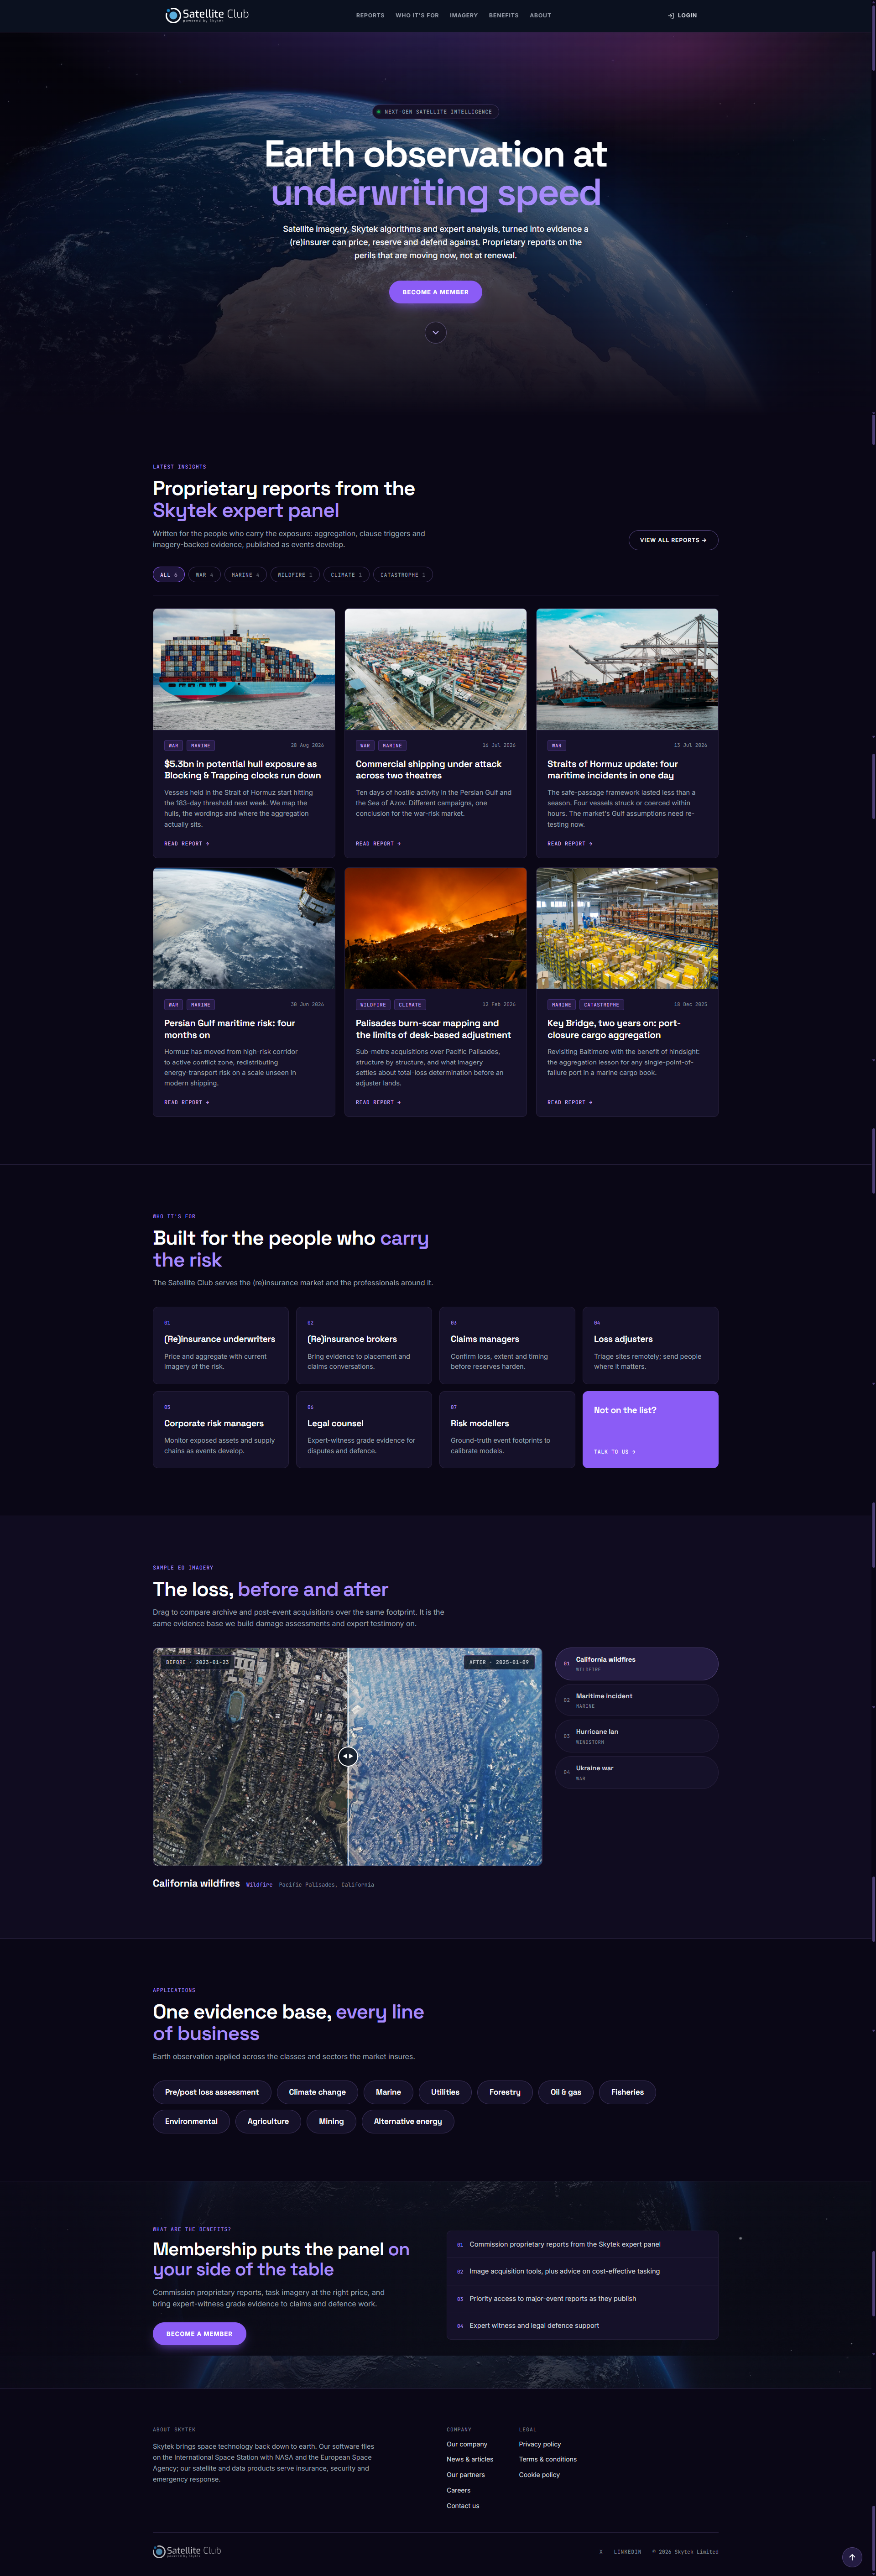
The homepage runs in the order a visitor’s questions arrive: what this is, the latest reports as proof the service is live, who it is for, sample imagery, the sectors it covers and what membership includes. Members skip the pitch and go straight to the reports.

Home

One claim, one way in

The hero makes a single claim, Earth observation at underwriting speed, and asks for one action: become a member. The reports library follows immediately, then the audience list, so visitors can see whether it is for them before any technology is explained.

  • Positioning
  • Self-selection
  • Membership CTA
satellite-club.skytek.com
Satellite Club home page, full length

Close-up · Reports library

Category filters

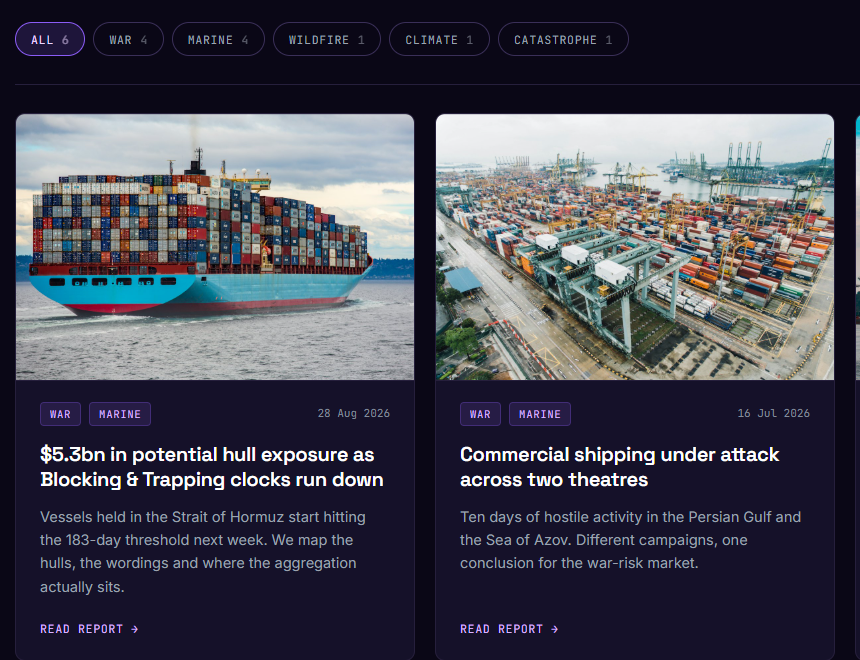
Reports can be narrowed by risk type (war, marine, wildfire, climate, catastrophe), with a count beside each so members can see where activity is.

Summary written for the market

Each card gives a short summary in insurance terms, enough to decide whether to open the full report.

Close-up of the Satellite Club reports library: category filters with counts and report cards with tags, dates and summaries

Category and date

Tags show the risk type, and the publication date sits on the same line, because a report’s age changes its value.

Read report

One clear action per card, leading to the full assessment.

Reports

Findings first, evidence underneath

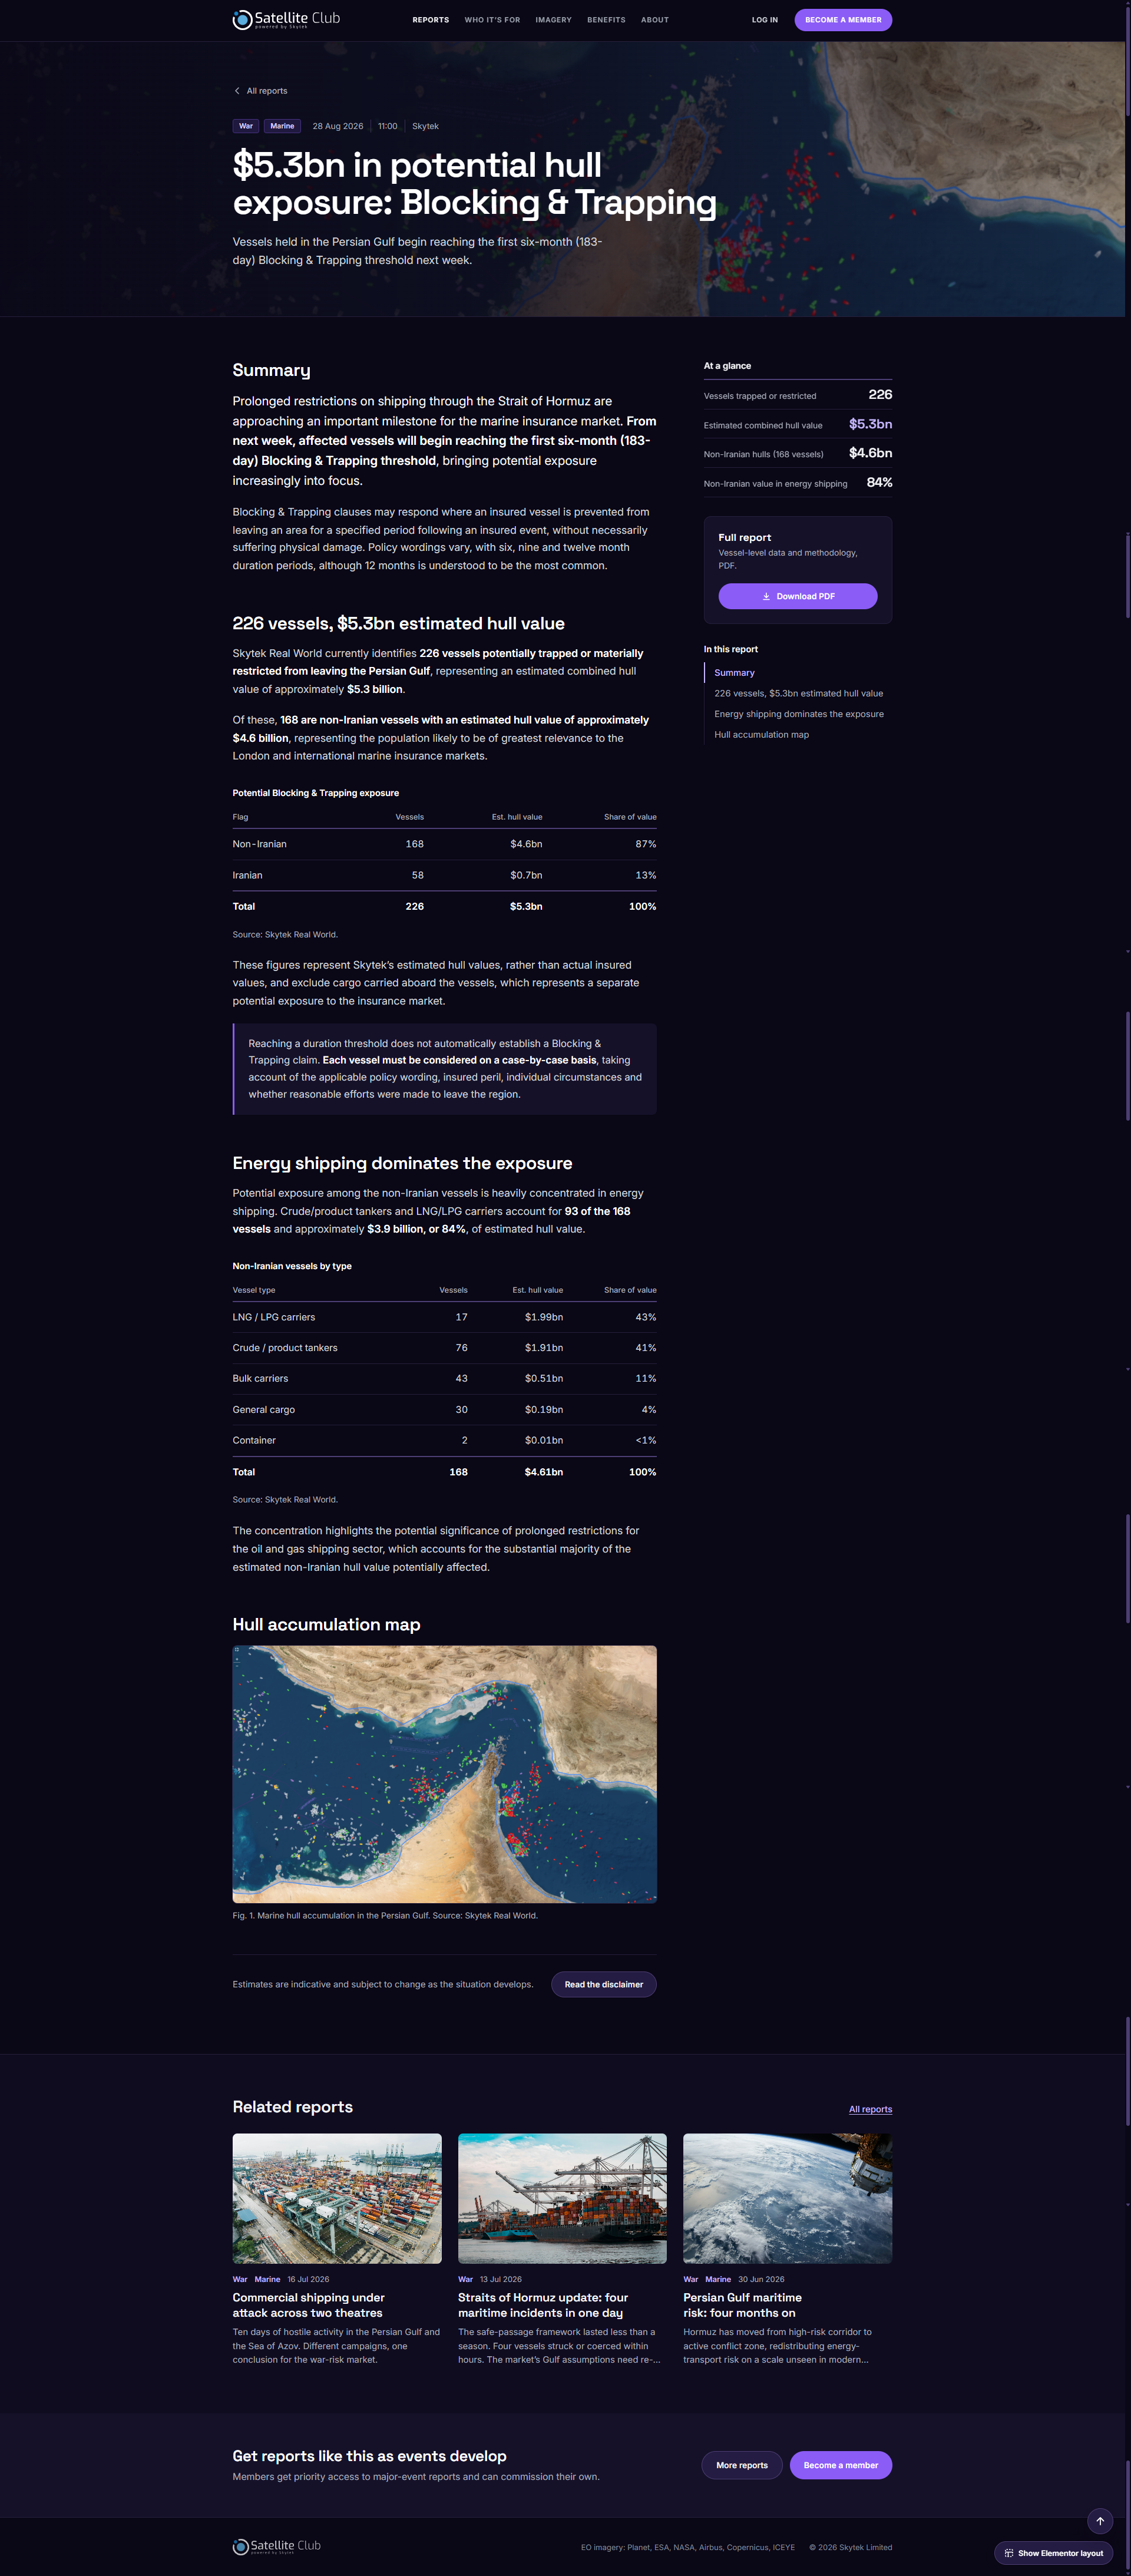
Every report follows the same template. The findings come first: a short summary, an ‘At a glance’ panel of key figures and a PDF download for the file. A contents list lets members jump between sections, and the evidence sits underneath: data tables with their sources, dated and captioned imagery and, where damage is mapped, a drag-to-compare layer over the satellite image. The imagery providers are credited on every page.

  • Summary first
  • Sourced data
  • PDF download
/ reports / hormuz-hull-exposure
Satellite Club report: $5.3bn in potential hull exposure, with summary, at-a-glance figures, exposure tables and a hull accumulation map
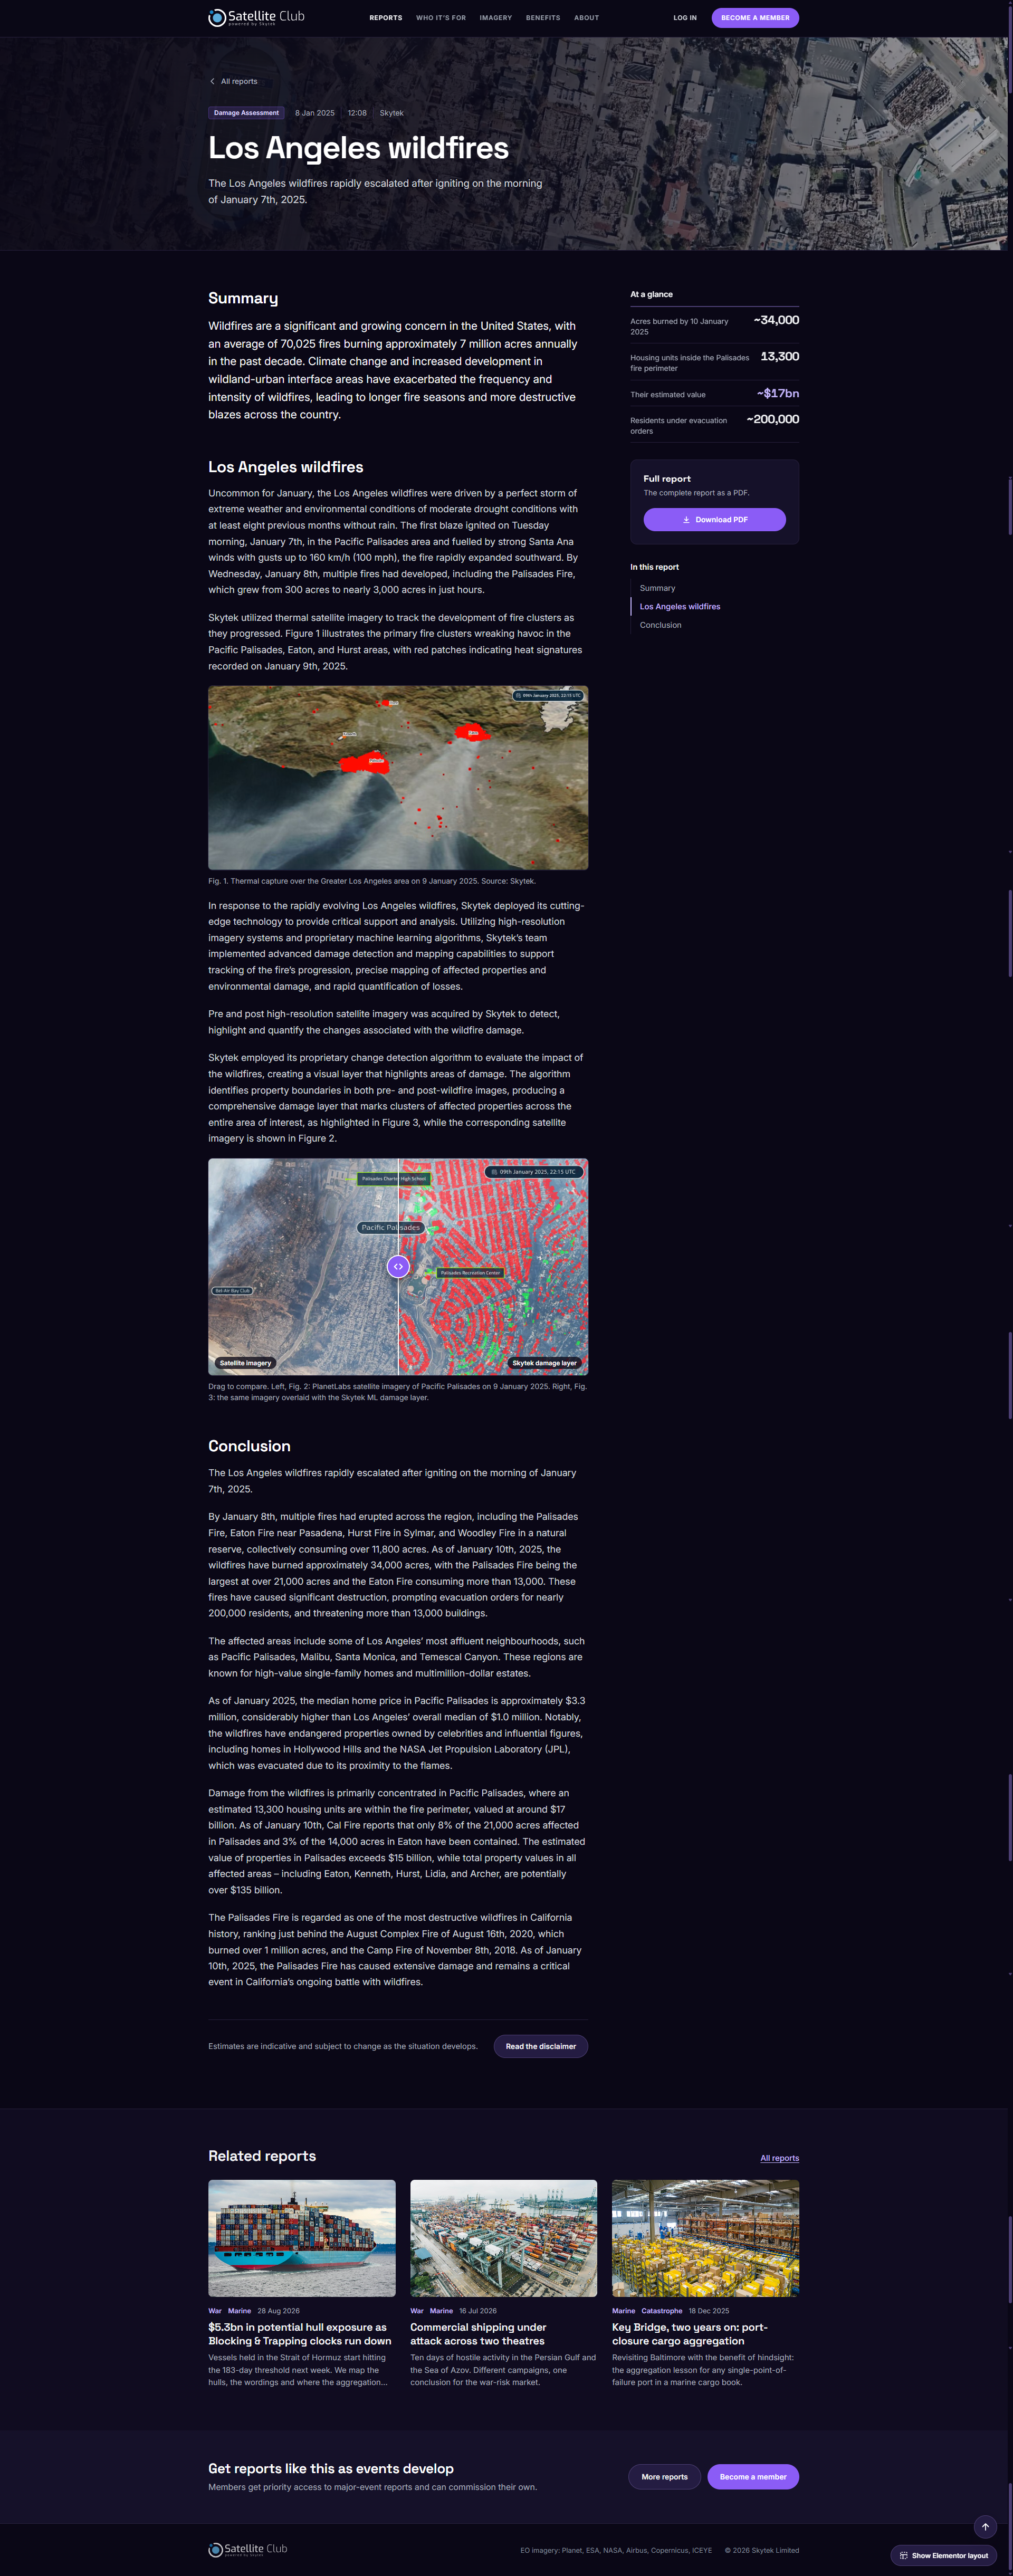
/ reports / los-angeles-wildfires
Satellite Club report: Los Angeles wildfires, with thermal imagery and a drag-to-compare damage layer over Pacific Palisades

Design decision · Anatomy of a report

Built to be read, checked and cited

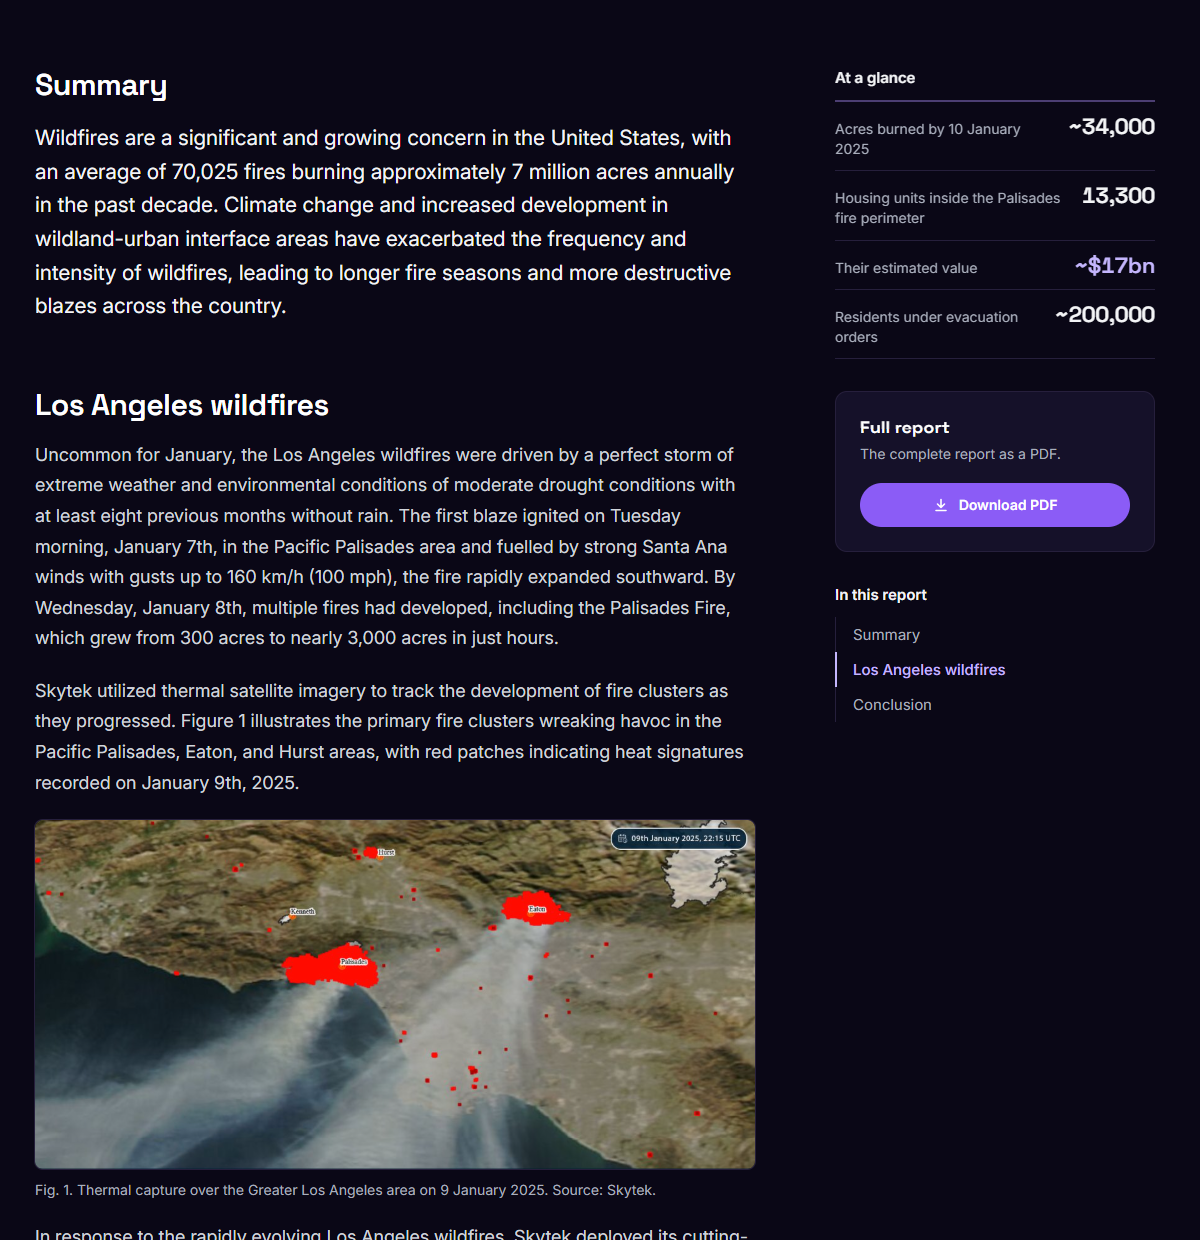
Visual evidence

The thermal capture sits directly under the paragraph that describes it, so the fire clusters named in the text can be found on the image.

Close-up of the Los Angeles wildfires report: summary, at-a-glance figures and a dated thermal capture with its caption

Information hierarchy

The figures an insurer needs first (acres burned, homes inside the perimeter, their value, residents evacuated) sit in an ‘At a glance’ panel beside the summary.

Context

Each image carries its capture date and time, and a numbered caption gives the location and source, so the evidence can be cited.

Visual Direction · Colour

Night-side black, with an ultraviolet to aurora gradient carrying every action

Void

#02040D

Deep Space

#131A2E

Ultraviolet

#9C4DFE

Ionosphere

#C9A7FF

Aurora

#FFDAFF

Outcome

Satellite imagery paired with expert analysis, delivered to the market that has to price the risk.

The design turns specialist Earth observation into something an insurance professional can work with. A member can see what has changed, open a dated, attributed assessment of a specific location, find the figures that matter at a glance, check the imagery for themselves and file the report as a PDF. A prospective member sees the same evidence before deciding to join.

The measure was not whether the imagery impressed anyone. It was whether an underwriter changed their decision because of what they saw.

Get In Touch

Let’s craft something meaningful together.

Contact Me

© 2026 Design by Fergal Keane

Back to Selected Works ↗Privacy ↗